MapDataLAB is a comprehensive data analytics platform built to help businesses make the most of their spatial or location-based data, which ultimately leads to better decisions, better customers and better business.

Latest News
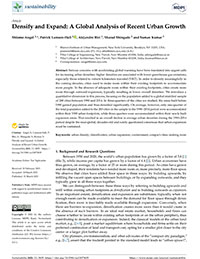
How to Fix India’s Decrepit CitiesCovid Cases in Greater Mumbai UACovid-19 Data Sets available for DownloadCovid 19 Impact AnalysisCovid-19 Dashboard for the Mumbai Metropolitan RegionNight Lights Tell The Story Of Dimming Economic Activity AcrossWhy India has the fastest-growing cities, LivemintEconomic Survey Vol 2Davao included in New York U study on public spaces, Minda NewsAtlas of Urban Expansion

About UXO-INDIA
Mahatma Education Society has jointly developed the Urban Expansion Observatory (UXO) in collaboration with New York University, Marron Institute of Urban Management. The observatory seeks to study cities around the world using GIS and remote sensing techniques. The UXO combines analysis of remote sensing along with state of the art data analytics and machine learning techniques to give cities and companies insights about their growth and development. The goal of the UXO is to ensure that cities around the world grow in equitable and sustainable ways.
Our Work
- MapDataLAB
- Data-Centric AI for Mapping Global Urban Deprivation
- Monitoring Land Subdivision and Irregular Settlement Formation in SSA
- Earth Observation for Informal Settlement Mapping
- The Evaluation of the Impact of the Ethiopia Urban Expansion Initiative
- Swachhata Har Kadam (SHK) Mobile Application and Dashboard
- Encroachment Alert System Mobile Application and Dashboard
- City Transport Indicator Study: 20 Macro Urban Areas
- Urban Shift Project
- Accommodating Urban Growth in the Latin American and Caribbean Region, IADB
- UK Pact Project
- C-40 Project
- Using Remote Sensing to Map and Measure Informal Settlements in Lusaka, Zambia, International Growth Center
- Atlas of Urban Expansion Website
- Covid-19 Data Sets available for Download
- Covid Cases in Greater Mumbai UA
- Covid 19 Impact Analysis
- Atlas of Urban Expansion
- 100 Resilient Cities
- Anatomy of Urban Density
- Drone Mapping
- Grenada Project
- Web Application Development


Data-Centric AI for Mapping Global Urban Deprivation
The Urban Observatory conducted a critical study for Mumbai as part of the IDEAtlas project, focusing on reference data collection and validation to map urban deprivation with precision. Supported by the ESA and targeting SDG 11.1.1, this project utilized a user- and data-centered AI approach to identify informal settlements.

Monitoring Land Subdivision and Irregular Settlement Formation in SSA
The project aims to create a consistent and robust training dataset for machine learning models. The categories of the training dataset are based on the morphological characteristics of different settlement types in cities across Sub-Saharan Africa (SSA). Initially, this project will test and explore proposed categories in a few pilot cities, adjust these categories if necessary, and then scale up to include all cities with populations of 100,000 or more in the region, from 1990 to 2020. Additionally, the study will capture the stages of consolidation of settlements forming in expansion areas during this period.

Earth Observation for Informal Settlement Mapping
The IDEAtlas project, funded by the European Space Agency (ESA), aims to develop AI-based methods to map and characterize slums using Earth Observation (EO) data, supporting the monitoring of SDG indicator 11.1.1, which focuses on the urban population living in slums or inadequate housing. Through a user-centered approach, the project involves national and local governments, civil society, and other stakeholders in co-designing and developing these solutions. Interactive Living Labs will engage participants in shaping the project's scope, with provisions for both in-person and online participation. UXO-India is one of the partners for the Mumbai living lab. It’s playing a key role in creation and validation of spatial and socio-economic datasets pertaining to the slums in Mumbai, India. The developed algorithms will be integrated into a cloud-based system and tested in eight cities. Local engagement and data collection are crucial for validating these EO solutions, with the ITC team leading efforts to tailor them based on user needs and feedback.

The Evaluation of the Impact of the Ethiopia Urban Expansion Initiative
In 2023-2024, the Marron Institute of Urban Management at New York University (NYU), with funding from Open Philanthropy, undertook an evaluation of its technical assistance provided to Ethiopian cities during 2013-2015. Urban Observatory was also part of base data creation on geo-spatial aspects for urban expansion planning. This initiative, conducted with the Ethiopian Ministry of Urban and Infrastructure, aimed to build capacity in urban planning and development for local authorities in 18 cities, focusing on preparing for projected population growth, planning urban expansion areas, establishing arterial road networks, and protecting environmentally sensitive lands. The evaluation assessed the effectiveness of these urban strategies and their socio-economic and health impacts on local communities nearly a decade later.
The Urban Observatory played a key role by conducting detailed geospatial analysis across all 18 cities, mapping urban expansion from 1990-2022, and creating an inventory of road networks and land use classifications within expansion areas. Analysts differentiated formal and informal land use and tracked changes in road infrastructure, focusing on width, surface condition, and connectivity. In 8 cities, “impact” and “control” areas were selected based on proximity to new arterial roads using satellite imagery, historical maps, and Halton point coordinates. Surveys were conducted to assess improvements in infrastructure and socio-economic conditions among residents.
This comprehensive geospatial approach, integrating satellite data with local land use plans, provided insights into the long-term impact of NYU's technical support on Ethiopia's urban expansion planning. The evaluation results offer critical evidence for policymakers on the sustained benefits of strategic urban planning and capacity-building initiatives, highlighting effective practices in urban growth management for sustainable, inclusive development.

Swachhata Har Kadam (SHK) Mobile Application and Dashboard
The primary objective of this application is to provide real-time monitoring on the cleanliness and infrastructure of public toilets across the municipal corporation area to aid in timely maintenance and decision-making. Track essential infrastructure elements: taps, buckets, doors, wash basins, flooring, water tanks, windows, lights, signage, and dustbins. Equip administrators with live data feeds on toilet conditions for proactive maintenance and monitoring. Increase accountability through continuous monitoring and enable decision making. Share data directly with authorities to ensure transparency and foster trust in public facility management. Contribute to cleanliness and infrastructure improvement of public and community toilets.

Encroachment Alert System Mobile Application and Dashboard
The Encroachment Alert System supports the New Urban Agenda by ensuring public spaces are free from unauthorized encroachments, promoting organized, safe, and resilient cities. By alerting authorities for timely action, it aligns with Sustainable Development Goals, particularly Goal 11 (Sustainable Cities and Communities) and Goal 16(Peace, Justice, and Strong Institutions), fostering equitable urban growth and transparent governance. We have had the pleasure of working with Panvel Municipal Corporation (PMC) on the development of the "Encroachment Alert System" application for Android, iOS and associated web portal/dashboard. This app helps to monitor encroachments in Panvel Municipal Corporation Area. This application tracks monthly encroachments and helps authority to monitor the status of encroachments. This application empowers to take data driven decisions and smoothen the encroachment tracking process.

City Transport Indicator Study: 20 Macro Urban Areas
In collaboration with WRI-India, we have developed consistent road infrastructure networks for 20 major urban agglomerations in India. This project computes indicators on congestion, connectivity, and mobility, providing critical insights to improve urban transportation systems. Focus of the project is on Road network analysis in 20 cities. UXO is tasked to collect road network data from the open source, curate and refine the data followed by computation of the requested indicators. The indicators will help to understand the quality of the node-segment-block setup in each urban area. The analysis of the performance of the cities based on the indicators would be the final stage of the project. The analytics need to be performed for the macro urban region (MUR). MUR are different based on the city sizes. Primarily we will go with 50 Kms, 30 Kms and 20 Kms for the large, medium and small sizes of cities.

Urban Shift Project
UXO research on 39 cities directly advances the objectives of the New Urban Agenda (NUA) and sustainable development. Through LANDSAT satellite image classification and urban landscape analysis spanning four decades (~1990, 2000, 2010, 2020), the project produces vital information on population shifts, urban extents, and city growth patterns.
This supports evidence-based policymaking, which is in line with the NUA's focus on encouraging sustainable urbanization. In addition to supporting efforts to densify existing footprints, an understanding of how cities grow over time facilitates better management of urban sprawl and encourages compact, inclusive, and resilient urban development—all of which are fundamental tenets of the NUA and the larger Sustainable Development Goals (SDGs), especially SDG 11 (Sustainable Cities and Communities).
This project provides valuable insights that can guide cities in adopting more sustainable, equitable, and efficient growth strategies.
https://www.shiftcities.org/accommodating-urban-growth#toc-course-outline-

Accommodating Urban Growth in the Latin American and Caribbean Region, IADB
Urban Observatory has engaged in a 4 phase study for 70 cities in Latin America and the Caribbean region. Under this project, UXO-India conducted a four period analysis of 69 Latin American cities. They then conducted an imagery-based assessment of urban layouts, measured the contributions of densification and expansion to urban development, and conducted an assessment of the components of density in the city. This will be delivered in the form of maps and tabular data.There are also contributions in the three case studies related to spatial data analysis and mapping. UXO-India created a digital platform (website) featuring quantitative data and satellite images for cities in the IADB project, with downloadable GIS files and maps, and tables and lists in Excel format.
UK Pact Project
Under this project, UXO-India created boundaries and marked the CBDs for 70 cities. This involved classifying the LANDSAT satellite images of 27 cities in Colombia for the four time periods i.e. ~1990, 2000, 2010, 2020. They also collected data on land cover change in 2000, 2010 and 2020, and calculated the change in land cover between 2000-2010 and 2010-2020. They also calculated the plot metrics for 13 metros and 28 cities/municipalities.

C-40 Project
Under this project, UXO-India studied 10 large metropolitan areas in Africa. The study included a four period analysis, city-wide land use analysis based on machine learning assessment from manually generated training data, gridded population data and density at 1 km resolution, a citywide road map, base data collection (distance to CBD, distance to nearest major road, distance to nearest T1 Builtup pixel, distance to nearest T2 Builtup pixel, distance to nearest T3 Builtup pixel, distance to nearest T4 Builtup pixel, slope in degrees, population and built year) for the projection of future urban extent, and created a city projection grid.

Using Remote Sensing to Map and Measure Informal Settlements in Lusaka, Zambia, International Growth Center
This project addresses the rapid urbanization in Lusaka, Zambia, where the urban population has grown threefold since 1990, largely due to rural-to-urban migration. Many of these migrants lack access to formal housing, leading to the formation of informal settlements that are often unmapped and lack essential services. To improve data on these settlements, the project used high-resolution satellite imagery to map and characterize Lusaka's informal areas. Analysts at the India Urban Expansion Observatory applied a structured approach, differentiating residential from non-residential zones and grouping them by observed characteristics of structures, parcels, and neighborhoods.
Using Google Earth and Bing imagery, analysts identified settlement features, such as roof materials, parcel shapes, and neighborhood road patterns, to determine the formality of an area. The imagery, primarily from 2020, enabled analysts to classify settlements, estimate growth over time, and provide a clearer picture of housing conditions. This map and typology support policymakers by detailing the physical and spatial characteristics of Lusaka’s informal settlements, offering essential insights to guide urban development and health initiatives.

Atlas of Urban Expansion Website
UXO-India maintained and hosted the Atlas of Urban Expansion Website, which contains information on a global sample of 200 cities.
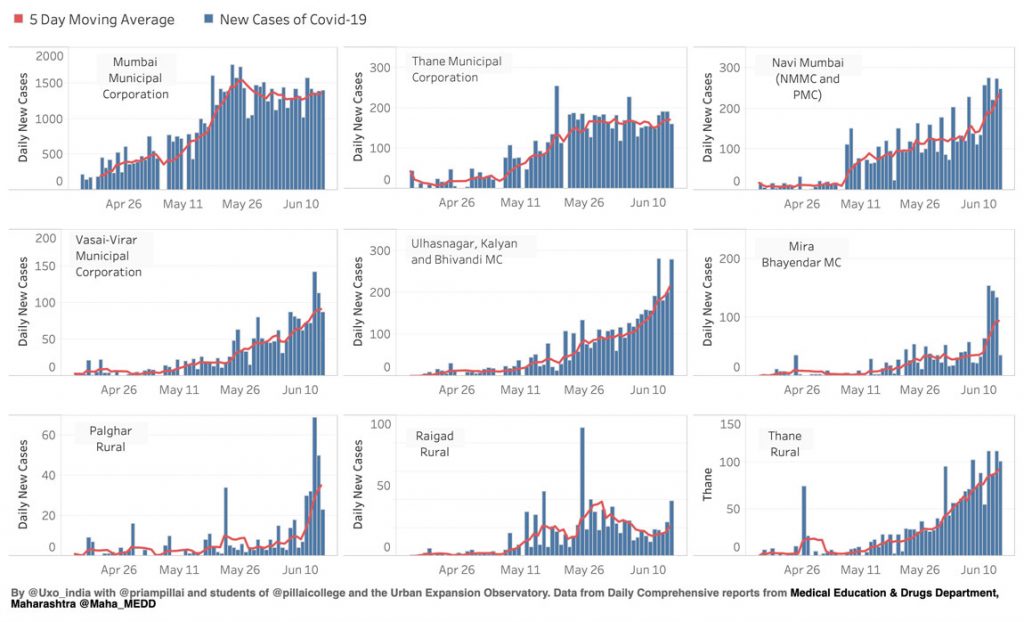
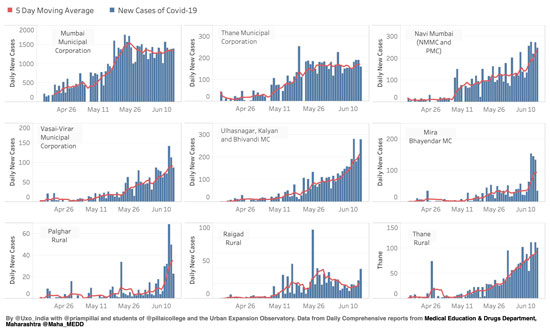
Covid Cases in Greater Mumbai UA
We have digitized the data in the daily comprehensive report put out by Medical Education & Drugs Department, Maharashtra @Maha_MEDD and are sharing it publicly here. The data is in a format that can be analysed easily and is available here.
We have also looked at the growth trajectories of Greater Mumbai UA consisting of Mumbai Municipal Corporation, Thane Municipal Corporation, Navi Mumbai Municipal Corporation, Panvel Municipal Corporation, Kalyan-Dombivili Municipal Corporation, Mira Bhayendar Municipal Corporation, Ulhasnagar Municipal Corporation,Vasai Virar Municipal Corporation, Bhivandi Nizamput Municipal Corporation.
Covid 19 Impact Analysis
Nighttime satellite data acts as a proxy for economic activity. The Urban Expansion Observatory along with MapDatalab analyzed night light satellite data all over India for the period of last five years (2015 to 2020). Using this dashboard we can visualize and compare year to year percent change in district level night lights as well as visualize night light satellite imagery data. Using this dashboard interface, we can look understand the impact of economic events and policy decisions (demonetization, natural disasters, covid-19 lockdowns etc).
Check out our Nightlights Dashboard here.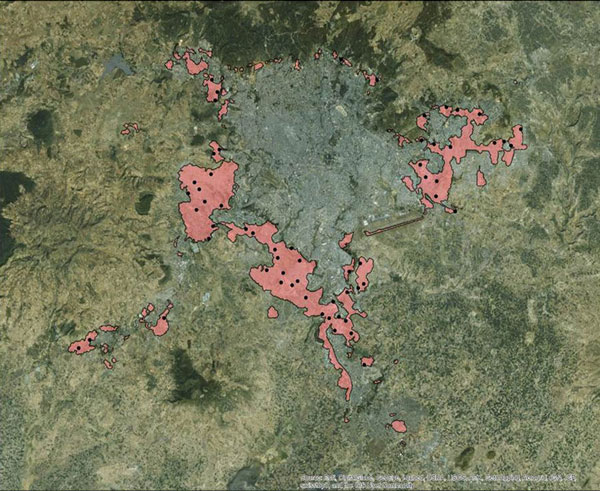
Atlas of Urban Expansion
Study of 200 cities around the world
It presents maps and measures of the recent, as well as the long-term, expansion of cities having a population of 100,000 people along with information regarding its quality, the performance of the housing sector, and the state of regulatory regimes, the areas built between 1990 and 2019 in an easily accessible format. It also provides authoritative data, information, and advice on current and emerging urbanization trends and conditions of a stratified global sample of 200 cities.
100 Resilient Cities
UXO along with 100 Resilient Cities- Pioneered by The Rockefeller Foundation (100 RC) is helping the cities around the world to strengthen and increase their capacity to survive, face and grow in these challenges.
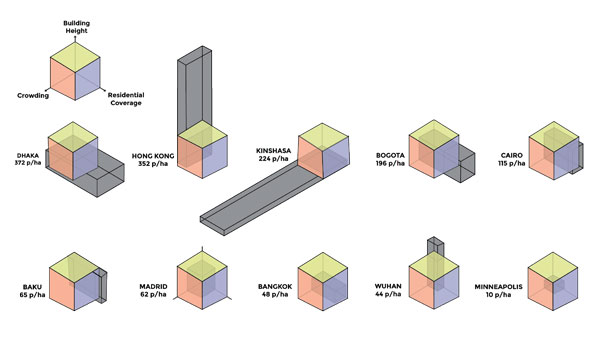
Anatomy of Urban Density
UXO helps in calculating temporal data of cities’ urban density for creating further planning policies. As a part of the process, building footprint, footprints of all the residential buildings and houses in the residential block (formal and informal) are studied.
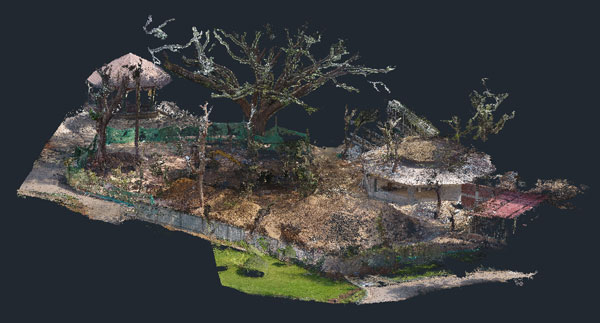
Drone Mapping
UXO has performed the drone mapping process for various sites including Byculla site, a project for TCS having approximately 10 to 12 sites across Maharashtra and for an area where a university in Nashik is going to be built over an open space.
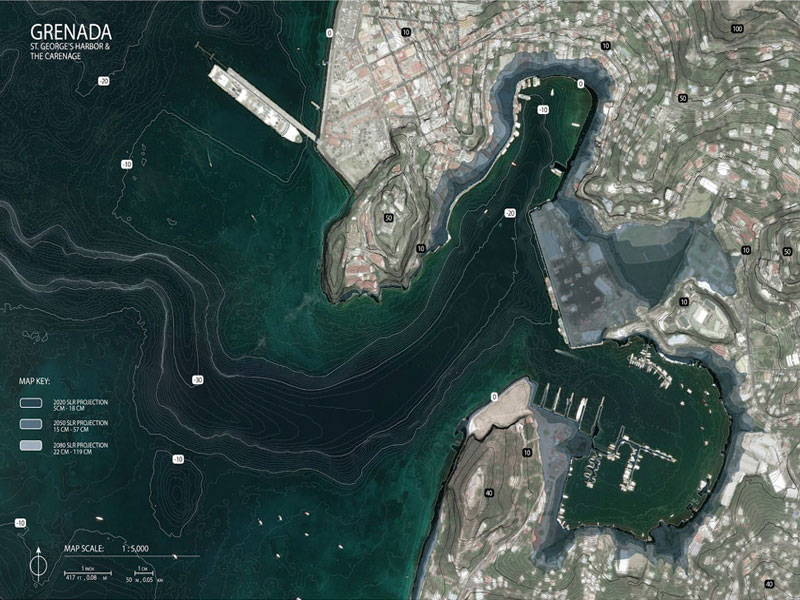
Grenada Project
Caribbean island country named Grenada is experiencing sea-level rise which is affecting its significant area. UXO along with NYU has an opportunity to assist the local government regarding the urban development and planning the urban policy for the coming 30 years.
Web Application Development
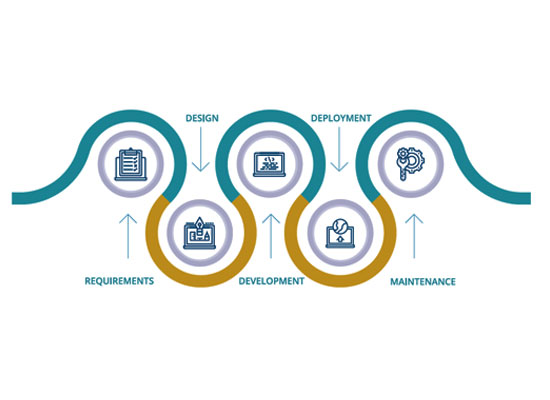
UXO facilitates the creation of interactive maps and applications which provides querying of the spatial information and helps in understanding the underlying pattern of the data. The applications can be customized according to the analysis requirements. We create desktop as well as mobile applications which can be hosted not only on public but also private servers. The data available on the application can be updated within seconds and can also provide 2D as well as 3D visualization of real-time information. Our application building process includes confirming the most efficient design for the application to meet the needs, developing the app and carrying out interrelated steps for deployment of the app and make it ready to use.
Publications

Powered by MES | Copyright © reserved UXO-INDIA |
Designed by Vidyadhan Educational Development Limited ![]()